It’s been a while since my last post but I’ve changed job a few weeks ago and I was in the process of adapting to the new environment 🙂
OK! It is time to sit back, relax a bit, have a cold beer, put some music on, and start writing!
A few weeks ago the number of visits on my blog exceeded the number of 50.000! So I decided to write a rather big article with a “celebratory” flavor 🙂
Though, before proceeding with the article, I would like to say a huge thank you to the SQL Server community and to each of you for supporting my efforts by visiting my blog, reading and referencing my articles, and commenting my posts.
As Data Access and PowerPivot are my favorite topics, in this article I will talk about a combination of two great technologies; WCF Data Services and PowerPivot.
To this end I am going to build a WCF Data Service that will be exposing data from a SQL Server 2008 R2 database as an RSS feed, then consume the data using PowerPivot and see how the data in PowerPivot is updated when the RSS feed is updated too.
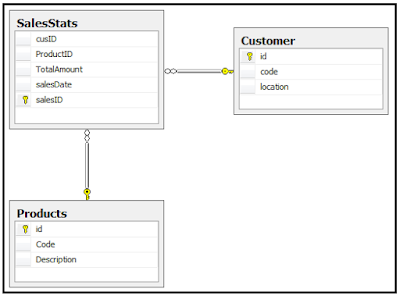
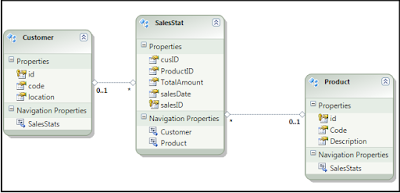
Let’s begin by taking a look at the database schema that is used for this post:
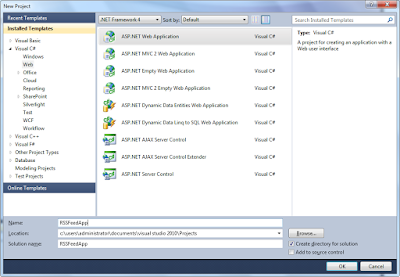
Now let’s start building that WCF Data Service!
We launch Visual Studio 2010 and we start building an ASP.NET Web Application:
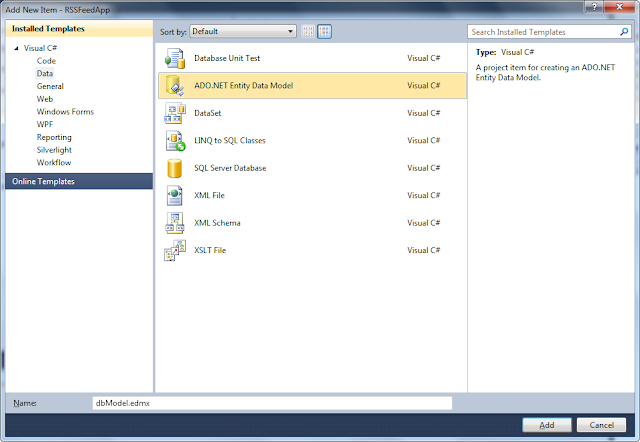
We then add a new item to our solution of the type “ADO.NET Entity Data Model”:
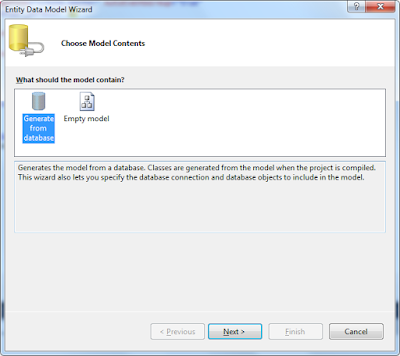
We choose to generate the data model directly from the database:
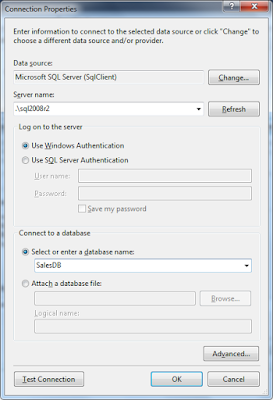
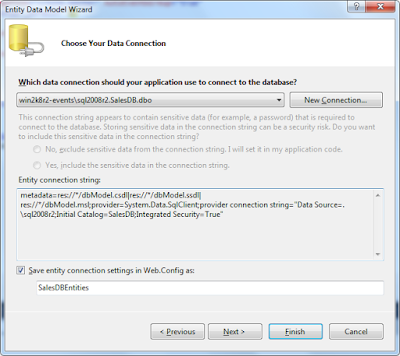
We set up the data connection:
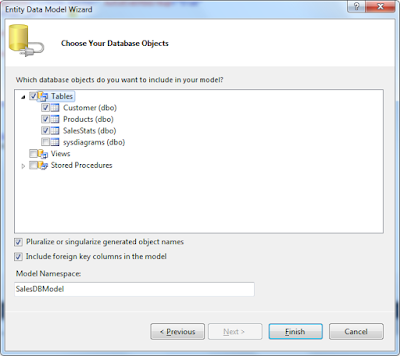
We then select the database objects to be included in the data model that will be generated:
The data model is ready:
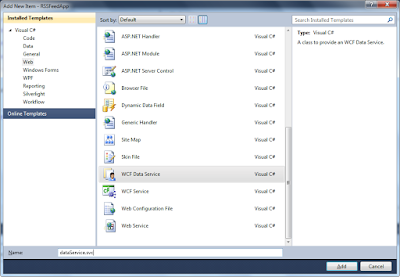
We then add another new item to the solution of the type “WCF Data Service”:
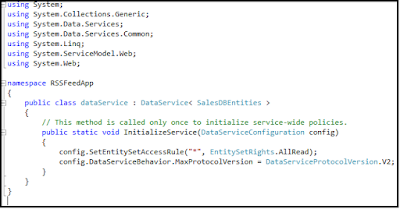
We also modify the source code as follows (this is only for demo purposes, in real-life you should be careful with the level of access you provide to your data):
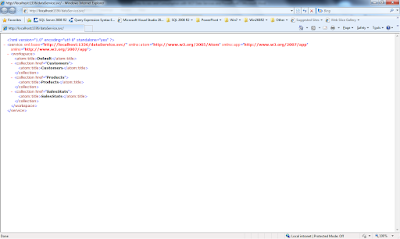
Well, that’s it! We run the solution and this is what we get in Internet Explorer:
The data is exposed as an RSS feed!
The data service is now ready.
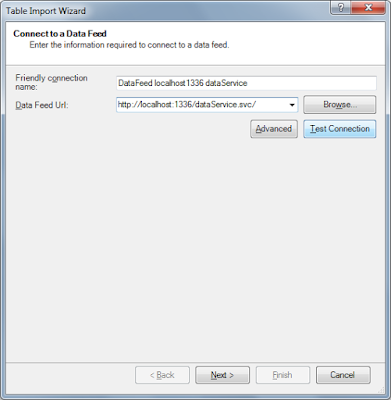
We copy the URL to the clipboard: http://localhost:1336/dataService.svc/
Now, for consuming the data service we are going to use PowerPivot.
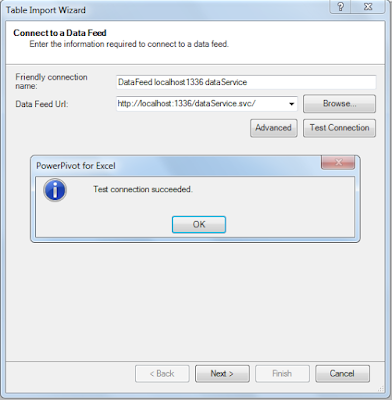
We launch Excel 2010, and then the PowerPivot dialog. We then click on the “From Data Feeds” button on the ribbon and we use as the Data Feed URL the URL we earlier copied to the clipboard (that is the URL for the Data Service):
We test the connection and we see that everything works well; our RSS Feed is up and running:
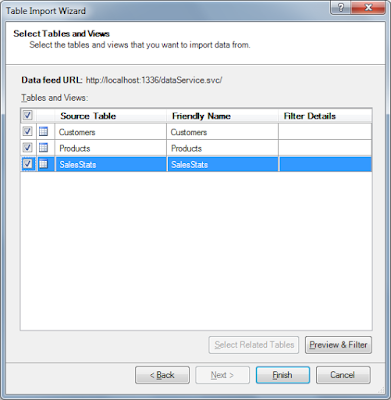
We click on “Next” and we then select the tables to be imported:
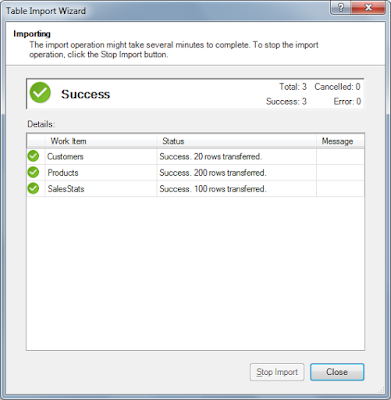
We click on “Finish” and we see that all the records were imported successfully:
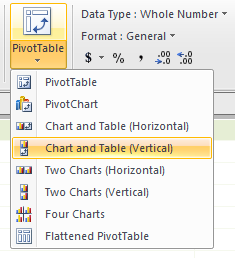
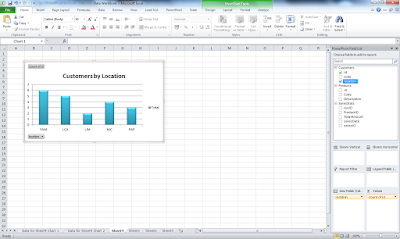
We then click on “PivotTable” on the ribbon and we select to build a “Chart and a table (vertical)”:
And this is what we get after visually building a simple query in the Excel Workbook using PowerPivot:
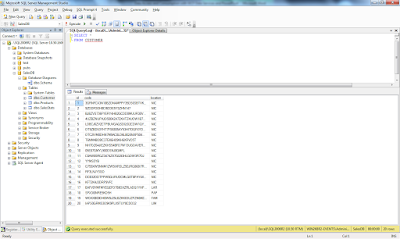
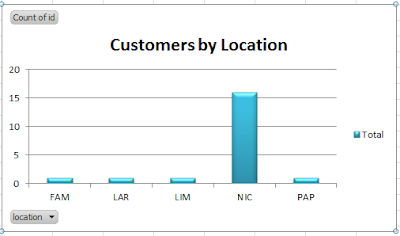
Now here comes the fun part. I am going to modify the contents of the “Customers” table so that most of the customers have as location the value “NIC” (yes, this stands for Nicosia :).
So 16 out of the 20 customers will now have “NIC” set as their location and each of the rest of the customers will have a different, unique location. After the data modification this is what we get in SSMS:
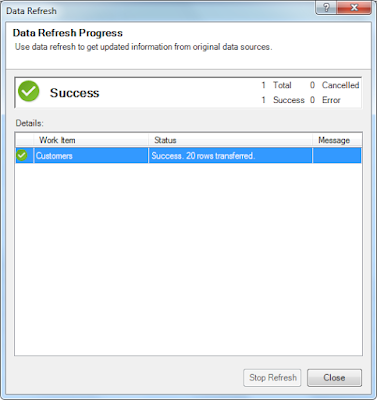
But how are these data modifications reflected in PowerPivot? It is actually very easy. We just enter into the PowerPivot dialog again and click on the “Refresh” button:
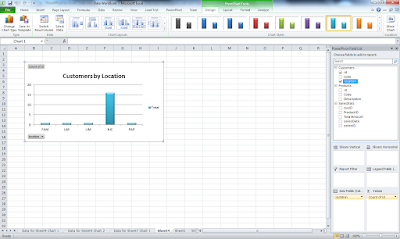
Then back in our Excel Workbook, we perform again the aggregation and we see that the chart is also updated:
What exactly happened when we clicked on the “Refresh” button was that PowerPivot communicated with the database in SQL Server via the RSS feed and tracked that the data contained in the “Customers” table was modified. To this end, it re-imported this data into the workbook. This is quite cool, isn’t it 🙂
Summing up, in this post we saw how we can build a simple WCF Data Service for exposing data via an RSS Feed, how can this data be imported into PowerPivot, and how can PowerPivot track any data changes thus reflecting them on its charts.
Until next time!
Learn essential SQL Server development tips! Enroll to our Online Course!
Sharpen your SQL Server database programming skills via a large set of tips on T-SQL and database development techniques. The course, among other, features over than 30 live demonstrations!
(Lifetime Access, Certificate of Completion, downloadable resources and more!)
Artemakis Artemiou is a seasoned Senior Database and AI/Automation Architect with over 20 years of expertise in the IT industry. As a Certified Database, Cloud, and AI professional, he has been recognized as a thought leader, earning the prestigious Microsoft Data Platform MVP title for nine consecutive years (2009-2018). Driven by a passion for simplifying complex topics, Artemakis shares his expertise through articles, online courses, and speaking engagements. He empowers professionals around the globe to excel in Databases, Cloud, AI, Automation, and Software Development. Committed to innovation and education, Artemakis strives to make technology accessible and impactful for everyone.
Views:2,721
We use cookies on our website to give you the most relevant experience by remembering your preferences and repeat visits. By clicking “Accept All”, you consent to the use of ALL the cookies. However, you may visit "Cookie Settings" to provide a controlled consent. Read More
This website uses cookies to improve your experience while you navigate through the website. Out of these, the cookies that are categorized as necessary are stored on your browser as they are essential for the working of basic functionalities of the website. We also use third-party cookies that help us analyze and understand how you use this website. These cookies will be stored in your browser only with your consent. You also have the option to opt-out of these cookies. But opting out of some of these cookies may affect your browsing experience.
Necessary cookies are absolutely essential for the website to function properly. These cookies ensure basic functionalities and security features of the website, anonymously.
Cookie
Duration
Description
cookielawinfo-checkbox-analytics
11 months
This cookie is set by GDPR Cookie Consent plugin. The cookie is used to store the user consent for the cookies in the category "Analytics".
cookielawinfo-checkbox-functional
11 months
The cookie is set by GDPR cookie consent to record the user consent for the cookies in the category "Functional".
cookielawinfo-checkbox-necessary
11 months
This cookie is set by GDPR Cookie Consent plugin. The cookies is used to store the user consent for the cookies in the category "Necessary".
cookielawinfo-checkbox-others
11 months
This cookie is set by GDPR Cookie Consent plugin. The cookie is used to store the user consent for the cookies in the category "Other.
cookielawinfo-checkbox-performance
11 months
This cookie is set by GDPR Cookie Consent plugin. The cookie is used to store the user consent for the cookies in the category "Performance".
viewed_cookie_policy
11 months
The cookie is set by the GDPR Cookie Consent plugin and is used to store whether or not user has consented to the use of cookies. It does not store any personal data.
Functional cookies help to perform certain functionalities like sharing the content of the website on social media platforms, collect feedbacks, and other third-party features.
Performance cookies are used to understand and analyze the key performance indexes of the website which helps in delivering a better user experience for the visitors.
Analytical cookies are used to understand how visitors interact with the website. These cookies help provide information on metrics the number of visitors, bounce rate, traffic source, etc.
Advertisement cookies are used to provide visitors with relevant ads and marketing campaigns. These cookies track visitors across websites and collect information to provide customized ads.