Wishing you all the best, a new year full of health, happiness, success and even more SQL Server knowledge!!! 🙂
As this is my first blog post in 2010, I thought that it should focus on a really hot topic! I hope you will enjoy it!
I called this post “The PowerPivot Experiment”. Here’s a little background information on how I decided writing this article.
About PowerPivot
When PowerPivot (formerly known as “Gemini”) was released, I really wanted to test its real capabilities by trying to import a really large amount of information right into excel and perform aggregations. To this end, I designed a simple relational database with five tables, populated it with data and performed my experiment using PowerPivot. For the record, the total amount of data was more than 100 Million Rows.
The PowerPivot Experiment Performed
In this post I will explain step-by-step the experiment, starting from the database design, then explaining the import process and finally, provide some examples on how I processed this huge amount of data.
Before describing the steps, I would like to list the several software technologies used, as well as the hardware and O/S configuration of my infrastructure.
Hardware – O/S Configuration:
- OS Name: Microsoft Windows Server 2008 R2 Enterprise
- OS Version: 6.1.7600 Build 7600
- System Type: x64-based PC
- Processor: Intel(R) Core(TM)2 Duo CPU T7250 @ 2.00GHz, 2001 Mhz, 2 Core(s), 2 Logical Processor(s)
- Installed Physical Memory (RAM): 4.00 GB
- Total Physical Memory: 4.00 GB
- Available Physical Memory: 2.47 GB
- Total Virtual Memory: 8.00 GB
- Available Virtual Memory: 6.10 GB
- Page File Space: 4.00 GB
Software tools/technologies used:
- MS SQL Server 2008 R2
- MS SQL Server PowerPivot
- MS Excel 2010
- Red Gate’s SQL Data Generator (for populating my database with sample data)
Database Design, Size and Other Statistics
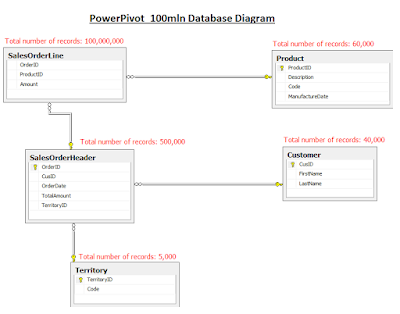
The following database diagram displays the tables participating in the DB Schema used in my experiment along with the table sizes in terms of total number of records:
Importing the Data Using PowerPivot:
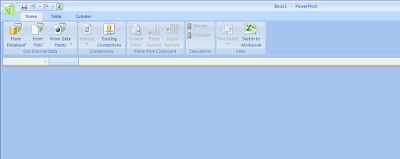
Step 1: Starting up Excel 2010 and launching PowerPivot Window
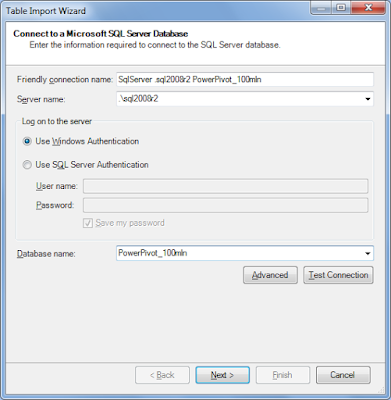
Step 2: Establishing a connection to a SQL Server Instance
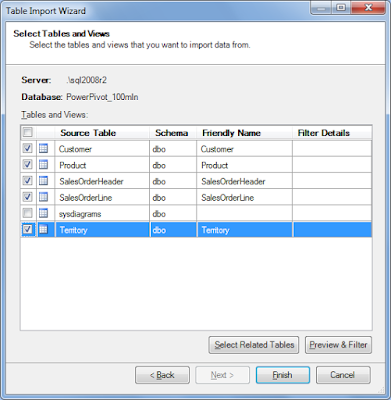
Step 3: Selecting SQL Server Database Tables for importing it into Excel 2010
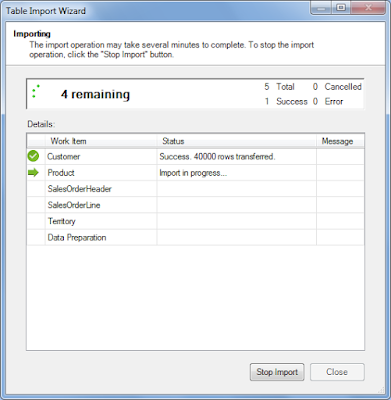
Step 4: Start Importing Data (Time: 15:46)
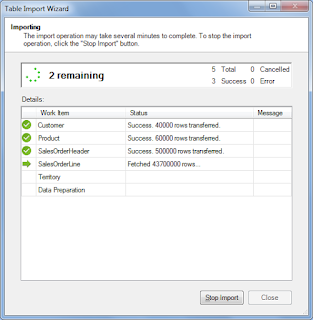
Let’s take a look on the status of the import process as it is occurring:
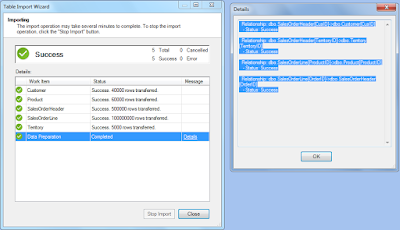
Step 5: Import completed! Total Time: 15:54 – 15:46 = 8 minutes!!!
It only took 8 minutes for the entire import process to complete! I personally believe that this is awesome! 🙂
Total number of records imported: 40,000 + 60,000 + 500,000 + 100,000,000 + 5,000 = 100,605,000
Working with the pivot tables
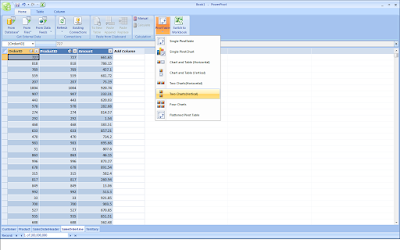
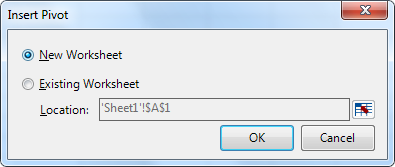
Right after importing the data, I proceeded with creating two pivot tables (by clicking on the “PivotTable” button in the PowerPivot window) for being able to easily perform aggregations:
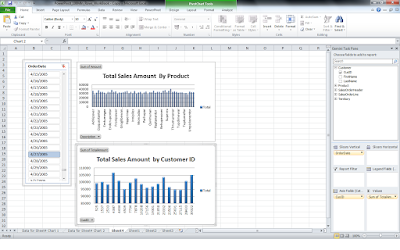
The following two screenshots are examples of some basic processing I did against the data I imported into Excel using PowerPivot. Using the PivotChart tools, I visually built OLAP queries answering business questions like: (i) What is the total sales amount by product, and (ii) What is the total sales amount by customer:
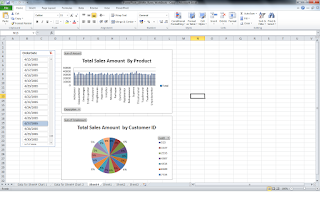
Note that you can also modify the charts as you could also do in earlier versions of Excel. For example, in the below screenshot you can see that the chart “Total Sales by Customer ID” was modified in order to illustrate the data using a pie chart:
Saving the workbook
After I finished with aggregating the data using the PivotChart tools, I saved the workbook. Note that by saving the workbook, the data that were imported earlier into the workbook using PowerPivot, are stored IN the workbook and you can access it anywhere as they are contained in the workbook file as a binary object.
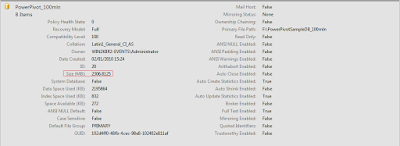
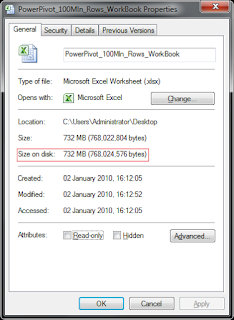
In my example, the database size was around 2300 MB. If you take a look at the following screenshot which presents the properties of the saved workbook, you can see that the file size is 732 MB:
Remarks
After performing the above practice, I was able to see in action and test some of the powerful capabilities of PowerPivot.
The data compression, the speed of the import process, the ease of creating rich Pivot Tables and OLAP queries are some of the great features of PowerPivot that take Business Intelligence a step further!
Well, that was a description of my “PowerPivot Experiment” 🙂
I hope you found this post useful!
There is more to come on PowerPivot so make sure you check back my blog soon!
Strengthen you SQL Server Development Skills – Enroll to our Online Course!
Check our online course titled “Essential SQL Server Development Tips for SQL Developers” (special limited-time discount included in link).
Via the course, you will sharpen your SQL Server database programming skills via a large set of tips on T-SQL and database development techniques. The course, among other, features over than 30 live demonstrations!

Did you find this article useful and interesting? Find hundreds of useful SQL Server programming/development articles in my eBook: “Developing with SQL Server (Second Edition)“.
Check our other related SQL Server Development articles.
Check out our latest software releases!
Subscribe to our newsletter and stay up to date!
Featured Online Courses:
- Boost SQL Server Database Performance with In-Memory OLTP
- Essential SQL Server Administration Tips
- SQL Server Fundamentals – SQL Database for Beginners
- Essential SQL Server Development Tips for SQL Developers
- The Philosophy and Fundamentals of Computer Programming
- .NET Programming for Beginners – Windows Forms with C#
- Introduction to SQL Server Machine Learning Services
- Introduction to Azure SQL Database for Beginners
- SQL Server 2019: What’s New – New and Enhanced Features
- Entity Framework: Getting Started – Complete Beginners Guide
- How to Import and Export Data in SQL Server Databases
- Learn How to Install and Start Using SQL Server in 30 Mins
- A Guide on How to Start and Monetize a Successful Blog
Read Also:
- Essential SQL Server Development Tips for SQL Developers
- How to Import and Export Data in SQL Server
- Listing all Tables of a Linked Server’s Database
- How to Import and Export Unstructured Data in SQL Server – FileTables
- How to Import and Export Unstructured Data in SQL Server – FILESTREAM
- How to Import and Export Unstructured Data in SQL Server – The IMAGE Datatype
- How to Enable PowerPivot in Excel 2016 or Later
- …more
Rate this article:
Reference: SQLNetHub.com (https://www.sqlnethub.com)
© SQLNetHub
Artemakis Artemiou is a seasoned Senior Database and AI/Automation Architect with over 20 years of expertise in the IT industry. As a Certified Database, Cloud, and AI professional, he has been recognized as a thought leader, earning the prestigious Microsoft Data Platform MVP title for nine consecutive years (2009-2018). Driven by a passion for simplifying complex topics, Artemakis shares his expertise through articles, online courses, and speaking engagements. He empowers professionals around the globe to excel in Databases, Cloud, AI, Automation, and Software Development. Committed to innovation and education, Artemakis strives to make technology accessible and impactful for everyone.


PowerPivot looks like a great tool. I was thinking about writing Excel applications in VB.NET that can handle vast amounts of data. Is there a way to import tables programmatically into the PowerPivot and manipulate them there?
Yes, it is an extremely powerful tool for doing BI!
For programmatically importing data into PowerPivot and manipulate it would require a developer API.
To my knowledge, at the time being there is not such an API available but it will be in the future!
You can check out the following link for more information on PowerPivot: http://powerpivotpro.com
Thanks for the post! Any chance you could post a backup of your sample database? Did you use the 32bit version of Office and PowerPivot?
Hi Rushabh,
You are welcome!
I used the 64-bit versions for everything!
You can download the DDL for generating the database using the following link:
http://public.blu.livefilestore.com/y1pbPjaS5lw9ZYe51Fv6ySkG_cgRiJ7PBJVEXQjRFXeydNDY1EiHQza-00EzgzXmnzu49aInbSYWJ58UvvX9MW2QA/PowerPivotExperiment_100mln_Schema.sql?download
I cannot upload the entire database (along with the data) as it is quite large!
Though, you can use Red Gate's SQL Data Generator for generating the sample data. You can find the tool on the following link:
http://www.red-gate.com/products/SQL_Data_Generator/index.htm
If you have any other questions please let me know!
Cheers!
Updated download link for the DB Schema DDL: http://cid-f7a5cb9a0405dcb5.office.live.com/self.aspx/.Public/SQL%5E_DDL/PowerPivotExperiment%5E_100mln%5E_Schema.sql